<template>
<div>
<lt-canvas ref="canvas" :width="750" :height="500"></lt-canvas>
</div>
</template>
<script>
import LightChart from 'light-chart';
export default {
components:{
ltCanvas:require("light-chart/canvas")
},
data(){
return {}
},
mounted(){
var Shape = LightChart.Shape;
Shape.registerShape('point', 'with-text', {
draw: function draw(cfg, container) {
var size = cfg.size;
var x = cfg.x;
var y = cfg.y;
var circle = container.addShape('Circle', {
className: 'point',
attrs: {
x: x,
y: y,
r: size,
fill: cfg.color
}
});
var origin = cfg.origin._origin;
var text = container.addShape('Text', {
className: 'text',
attrs: {
x: x,
y: y - size - 4,
fill: '#000',
text: origin.name + '\n' + '$' + origin.volumes + 'billion',
textBaseline: 'bottom',
textAlign: 'center',
fontSize: 10,
lineHeight: 10
}
});
return [circle, text];
}
});
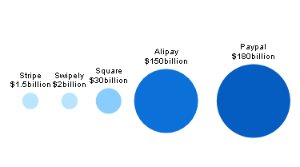
var data = [{
name: 'Stripe',
volumes: 1.5,
x: 0.8,
y: 50
}, {
name: 'Swipely',
volumes: 2,
x: 2.5,
y: 50
}, {
name: 'Square',
volumes: 30,
x: 4.2,
y: 50
}, {
name: 'Alipay',
volumes: 150,
x: 6.7,
y: 50
}, {
name: 'Paypal',
volumes: 180,
x: 10.5,
y: 50
}];
let chart = new LightChart.Chart({
ltCanvas:this.$refs.canvas
});
chart.source(data, {
y: {
min: 0,
max: 100
},
x: {
max: 12,
tickInerval: 1
}
});
chart.axis(false);
chart.legend(false);
chart.point().position('x*y').color('volumes', '#BAE7FF-#1890FF-#0050B3').size('volumes', [10, 50]).shape('with-text');
chart.render();
}
}
</script>
<style scoped>
</style>
|