<template>
<div>
<lt-canvas ref="canvas" :width="750" :height="500"></lt-canvas>
</div>
</template>
<script>
import LightChart from 'light-chart';
export default {
components:{
ltCanvas:require("light-chart/canvas")
},
data(){
return {}
},
mounted(){
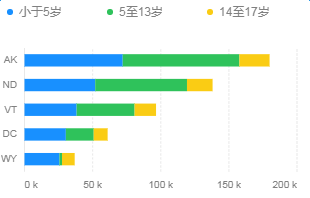
const data = [
{ State: 'WY', 年龄段 : '小于5岁', 人口数量: 25635 },
{ State: 'WY', 年龄段 : '5至13岁', 人口数量: 1890 },
{ State: 'WY', 年龄段 : '14至17岁', 人口数量: 9314 },
{ State: 'DC', 年龄段 : '小于5岁', 人口数量: 30352 },
{ State: 'DC', 年龄段 : '5至13岁', 人口数量: 20439 },
{ State: 'DC', 年龄段 : '14至17岁', 人口数量: 10225 },
{ State: 'VT', 年龄段 : '小于5岁', 人口数量: 38253 },
{ State: 'VT', 年龄段 : '5至13岁', 人口数量: 42538 },
{ State: 'VT', 年龄段 : '14至17岁', 人口数量: 15757 },
{ State: 'ND', 年龄段 : '小于5岁', 人口数量: 51896 },
{ State: 'ND', 年龄段 : '5至13岁', 人口数量: 67358 },
{ State: 'ND', 年龄段 : '14至17岁', 人口数量: 18794 },
{ State: 'AK', 年龄段 : '小于5岁', 人口数量: 72083 },
{ State: 'AK', 年龄段 : '5至13岁', 人口数量: 85640 },
{ State: 'AK', 年龄段 : '14至17岁', 人口数量: 22153 }
];
let chart = new LightChart.Chart({
ltCanvas:this.$refs.canvas
});
chart.source(data, {
'人口数量': {
tickCount: 5
}
});
chart.coord({
transposed: true
});
chart.axis('State', {
line: LightChart.Global._defaultAxis.line,
grid: null
});
chart.axis('人口数量', {
line: null,
grid: LightChart.Global._defaultAxis.grid,
label(text, index, total) {
const textCfg = {
text: text / 1000 + ' k'
};
if (index === 0) {
textCfg.textAlign = 'left';
}
if (index === total - 1) {
textCfg.textAlign = 'right';
}
return textCfg;
}
});
chart.interval().position('State*人口数量').color('年龄段').adjust('stack');
chart.render();
}
}
</script>
<style scoped>
</style>
|