<template>
    <div>
       <lt-canvas ref="canvas" :width="750" :height="500"></lt-canvas>
    </div>
</template>
<script>
    import LightChart from 'light-chart';
    export default {
        components:{
            ltCanvas:require("light-chart/canvas")
        },
        data(){
            return {}
        },
        mounted(){
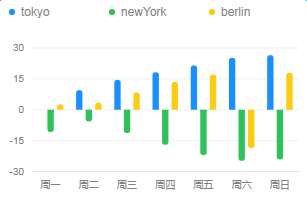
             const data = [
                { time: '周一', tem: 0, city: 'tokyo' },
                { time: '周二', tem: 9.5, city: 'tokyo' },
                { time: '周三', tem: 14.5, city: 'tokyo' },
                { time: '周四', tem: 18.2, city: 'tokyo' },
                { time: '周五', tem: 21.5, city: 'tokyo' },
                { time: '周六', tem: 25.2, city: 'tokyo' },
                { time: '周日', tem: 26.5, city: 'tokyo' },
                { time: '周一', tem: -10.8, city: 'newYork' },
                { time: '周二', tem: -5.7, city: 'newYork' },
                { time: '周三', tem: -11.3, city: 'newYork' },
                { time: '周四', tem: -17, city: 'newYork' },
                { time: '周五', tem: -22, city: 'newYork' },
                { time: '周六', tem: -24.8, city: 'newYork' },
                { time: '周日', tem: -24.1, city: 'newYork' },
                { time: '周一', tem: 2.6, city: 'berlin' },
                { time: '周二', tem: 3.5, city: 'berlin' },
                { time: '周三', tem: 8.4, city: 'berlin' },
                { time: '周四', tem: 13.5, city: 'berlin' },
                { time: '周五', tem: 17, city: 'berlin' },
                { time: '周六', tem: -18.6, city: 'berlin' },
                { time: '周日', tem: 17.9, city: 'berlin' }
            ];
            let chart = new LightChart.Chart({
                ltCanvas:this.$refs.canvas
            });
            chart.source(data, {
                tem: {
                tickCount: 5
                }
            });
            chart.interval().position('time*tem')
                .color('city')
                .adjust('dodge')
                .style('tem', {
                radius(val) {
                    return val > 0 ? [ 3, 3, 0, 0 ] : [ 0, 0, 3, 3];
                }
            })
            chart.render();
        }
    }
</script>
|

