
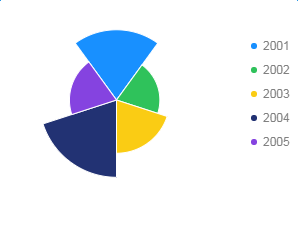
# 玫瑰图
# 效果
# 使用方法
<template>
    <div>
       <lt-canvas ref="canvas" :width="750" :height="500"></lt-canvas>
    </div>
</template>
<script>
import LightChart from "light-chart";
export default {
  components: {
    ltCanvas: require("light-chart/canvas")
  },
  data() {
    return {};
  },
  mounted() {
    var data = [
      {
        year: "2001",
        population: 41.8
      },
      {
        year: "2002",
        population: 25.8
      },
      {
        year: "2003",
        population: 31.7
      },
      {
        year: "2004",
        population: 46
      },
      {
        year: "2005",
        population: 28
      }
    ];

    let chart = new LightChart.Chart({
        ltCanvas:this.$refs.canvas
    });
    chart.source(data);
    chart.coord("polar");
    chart.legend({
      position: "right"
    });
    chart.axis(false);
    chart
      .interval()
      .position("year*population")
      .color("year")
      .style({
        lineWidth: 1,
        stroke: "#fff"
      });
    chart.render();
  }
};
</script>
<style scoped>
</style>