# 简介
light chart是一个基于F2框架封装,专注于移动,开箱即用的可视化解决方案,支持 H5 同时兼容jsn环境。完备的图形语法理论,满足你的各种可视化需求。
# 安装
1.首先需要安装lighting开发工具,安装方法参考 开发工具安装。
2.下载light chart模块,在源代码目录的lib目录执行:npm install -d --save light-chart。
3.引入组件,在需要使用light chart图表库的vue文件中使用如下代码:import LightChart from 'light-chart',并注册组件 components:{ ltCanvas:require ("light-chart/canvas")}。
4.使用组件,<lt-canvas ref="canvas" :width="750" :height="500"></lt-canvas>。
5.每个图表的使用详情参见后面章节light chart。
# 快速开始
light-chart 支持两种绘图方式:jsn 渲染方式和嵌套 h5 渲染。当页面内图表较多时建议使用嵌套 h5 渲染的方式以提升性能。
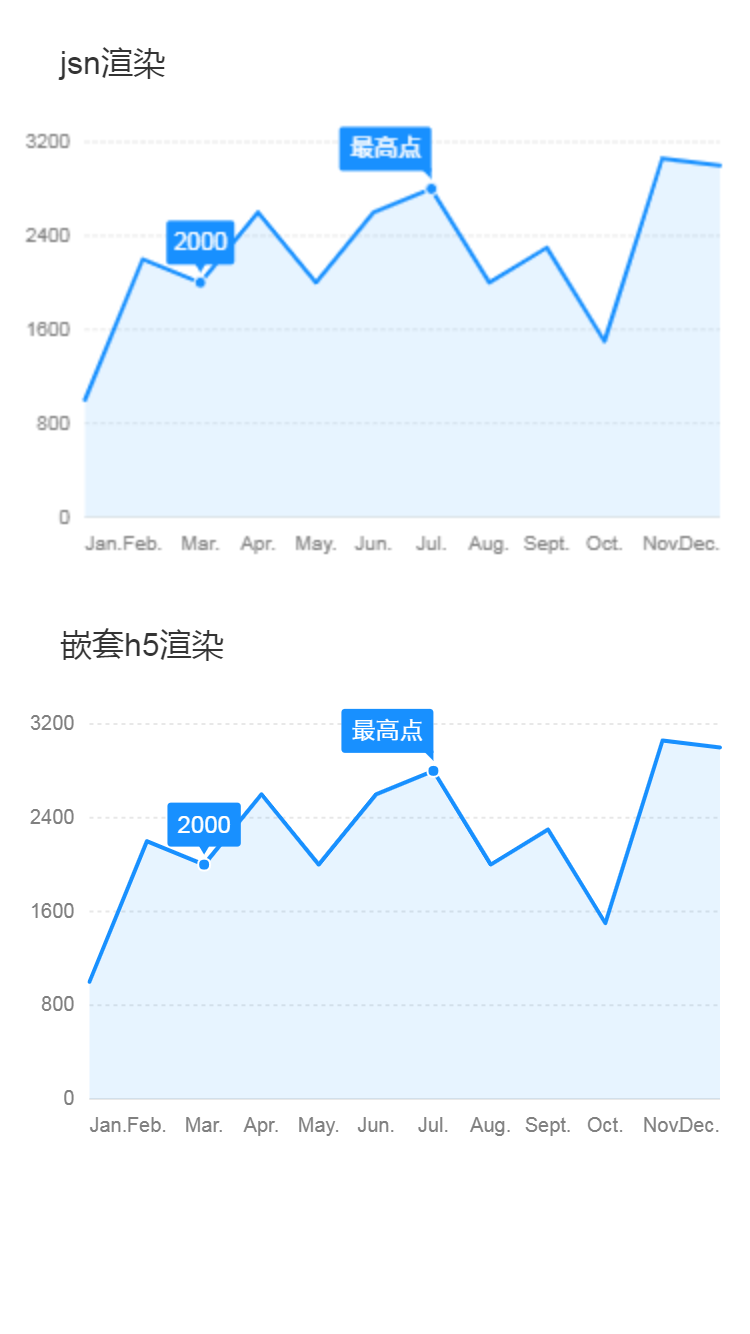
<text class="title">jsn渲染</text>
<lt-canvas ref="canvas" :width="750" :height="500"></lt-canvas>
<text class="title">嵌套h5渲染</text>
<web-canvas ref="webCanvas" :width="750" :height="500" src="canvas-wrap/index.html"></web-canvas>
注:使用h5方式渲染,需要传入
src属性,指向工程内自定义的绘图模板,也可使用light提供的默认模板 (opens new window)。
import LightChart from 'light-chart';
export default {
    components:{
        ltCanvas:require("light-chart/canvas"),
        webCanvas:require("light-chart/webCanvas")
    },
    data(){
        return {}
    },
    mounted(){
        // 对数据源格式的要求,仅仅是 JSON 数组,数组的每个元素是一个标准 JSON 对象。
        const data = [
            { time: 'Jan.', tem: 1000 },
            { time: 'Feb.', tem: 2200 },
            { time: 'Mar.', tem: 2000 },
            { time: 'Apr.', tem: 2600 },
            { time: 'May.', tem: 2000 },
            { time: 'Jun.', tem: 2600 },
            { time: 'Jul.', tem: 2800 },
            { time: 'Aug.', tem: 2000 },
            { time: 'Sept.', tem: 2300 },
            { time: 'Oct.', tem: 1500 },
            { time: 'Nov.', tem: 3060 },
            { time: 'Dec.', tem: 3000 },
        ];
        const scale = {
            time: {
                range: [ 0, 1 ]
            },
            tem: {
                tickCount: 5,
                min: 0
            }
        }


        //jsn方式绘图

        // 1. 创建 Chart 对象
        let chart = new LightChart.Chart({
            ltCanvas:this.$refs.canvas
        });

        // 2. 载入数据源
        chart.source(data);
        chart.scale(scale);

        // 3. 创建图形语法,绘制折线图,由 time 和 tem 两个属性决定图形位置,time 映射至 x 轴,tem 映射至 y 轴
        chart.axis('time', {
            label(text, index, total) {
                var textCfg = {};
                if (index === 0) {
                    textCfg.textAlign = 'left';
                }
                if (index === total - 1) {
                    textCfg.textAlign = 'right';
                }
                return textCfg;
            }
        });
        chart.tooltip({
            showCrosshairs: true,
            onShow(ev) {
                var { items } = ev;
                items[0].name = items[0].title;
            }
        });
        chart.guide().tag({
            position: [6, 2800],
            content: '最高点',
            offsetY: -5,
            direct: 'tl'
        });
        chart.guide().tag({
            position: [2, 2000],
            content: '2000',
            offsetY: -5,
            direct: 'tc'
        });
        chart.area().position('time*tem');
        chart.line().position('time*tem');

        // 4. 渲染图表
        chart.render();


        //h5方式绘图
        //传入绘图指令(为了实现对低端移动设备更好的兼容,不要在指令中使用es6语法)
        this.$refs.webCanvas.draw(`
            chart.source(${JSON.stringify(data)});
            chart.scale(${JSON.stringify(scale)});

            chart.axis('time', {
                label:function(text, index, total) {
                    var textCfg = {};
                    if (index === 0) {
                        textCfg.textAlign = 'left';
                    }
                    if (index === total - 1) {
                        textCfg.textAlign = 'right';
                    }
                    return textCfg;
                }
            });
            chart.tooltip({
                showCrosshairs: true,
                onShow:function(ev) {
                    var { items } = ev;
                    items[0].name = items[0].title;
                }
            });
            chart.guide().tag({
                position: [6, 2800],
                content: '最高点',
                offsetY: -5,
                direct: 'tl'
            });
            chart.guide().tag({
                position: [2, 2000],
                content: '2000',
                offsetY: -5,
                direct: 'tc'
            });
            chart.area().position('time*tem');
            chart.line().position('time*tem');
            chart.render();
        `);
    }
}
更多示例:chart.js (opens new window)。
手机扫码观看 demo