
# 饼图
# 效果
# 使用方法
<template>
<div>
<lt-canvas ref="canvas" :width="750" :height="500"></lt-canvas>
</div>
</template>
<script>
import LightChart from 'light-chart';
export default {
components:{
ltCanvas:require("light-chart/canvas")
},
data(){
return {}
},
mounted(){
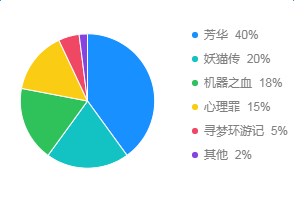
const map = {
'芳华': '40%',
'妖猫传': '20%',
'机器之血': '18%',
'心理罪': '15%',
'寻梦环游记': '5%',
'其他': '2%',
};
const data = [
{ name: '芳华', proportion: 0.4, a: '1' },
{ name: '妖猫传', proportion: 0.2, a: '1' },
{ name: '机器之血', proportion: 0.18, a: '1' },
{ name: '心理罪', proportion: 0.15, a: '1' },
{ name: '寻梦环游记', proportion: 0.05, a: '1' },
{ name: '其他', proportion: 0.02, a: '1' }
];
let chart = new LightChart.Chart({
ltCanvas:this.$refs.canvas
});
chart.source(data);
chart.legend({
position: 'right',
itemFormatter(val) {
return val + ' ' + map[val];
},
unCheckStyle: {
fontWeight: '800'
}
});
chart.coord('polar', {
transposed: true,
radius: 0.8
});
chart.axis(false);
chart.interval()
.position('a*proportion')
.color('name', [ '#1890FF', '#13C2C2', '#2FC25B', '#FACC14', '#F04864', '#8543E0' ])
.adjust('stack')
.style({
lineWidth: 1,
stroke: '#fff'
});
chart.render();
}
}
</script>
<style scoped>
</style>