
# 层叠柱状图(区间)
# 效果
# 使用方法
<template>
<div>
<lt-canvas ref="canvas" :width="750" :height="500"></lt-canvas>
</div>
</template>
<script>
import LightChart from 'light-chart';
export default {
components:{
ltCanvas:require("light-chart/canvas")
},
data(){
return {}
},
mounted(){
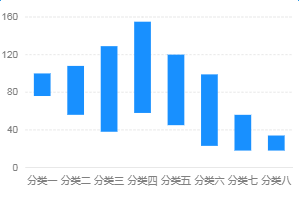
const data = [
{ x: '分类一', y: [ 76, 100 ] },
{ x: '分类二', y: [ 56, 108 ] },
{ x: '分类三', y: [ 38, 129 ] },
{ x: '分类四', y: [ 58, 155 ] },
{ x: '分类五', y: [ 45, 120 ] },
{ x: '分类六', y: [ 23, 99 ] },
{ x: '分类七', y: [ 18, 56 ] },
{ x: '分类八', y: [ 18, 34 ] },
];
let chart = new LightChart.Chart({
ltCanvas:this.$refs.canvas
});
chart.source(data, {
y: {
tickCount: 5
}
});
chart.interval().position('x*y');
chart.render();
}
}
</script>