
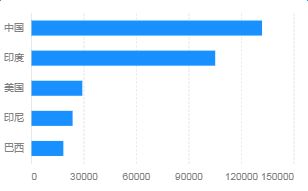
# 基础条形图
# 效果
# 使用方法
<template>
    <div>
       <lt-canvas ref="canvas" :width="750" :height="500"></lt-canvas>
    </div>
</template>
<script>
    import LightChart from 'light-chart';
    export default {
        components:{
            ltCanvas:require("light-chart/canvas")
        },
        data(){
            return {}
        },
        mounted(){
            const { Global } = LightChart;
            const data = [
                { country: '巴西', population: 18203 },
                { country: '印尼', population: 23489 },
                { country: '美国', population: 29034 },
                { country: '印度', population: 104970 },
                { country: '中国', population: 131744 }
            ];
            let chart = new LightChart.Chart({
                ltCanvas:this.$refs.canvas
            });

            chart.source(data, {
                population: {
                tickCount: 5
                }
            });
            chart.coord({
                transposed: true
            });
            chart.axis('country', {
                line: Global._defaultAxis.line,
                grid: null
            });
            chart.axis('population', {
                line: null,
                grid: Global._defaultAxis.grid,
                label(text, index, total) {
                const textCfg = {};
                if (index === 0) {
                    textCfg.textAlign = 'left';
                }
                if (index === total - 1) {
                    textCfg.textAlign = 'right';
                }
                return textCfg;
                }
            });
            chart.interval().position('country*population');
            chart.render();
        }
    }
</script>
<style scoped>

</style>